Stat-Ease Blog

Categories
Magic of multifactor testing revealed by fun physics experiment
If you haven't discovered Mark Anderson's Stats Made Easy blog yet, check it out! Mark offers a wry look at all things statistical and/or scientific from an engineering perspective. You will find posts on topics as varied as nature, science, sports, politics, and DOE. His latest post, Magic of multifactor testing, involves a fun DOE with bouncy balls.
The first article follows the setup of Mark's DOE. At the bottom of Part 1, click on the Related Links tab to find Part 2 (Results) and Part 3 (Data and Details)
That’s a Wrap!
The 2020 Online DOE Summit was a remarkable success! If you missed any of it, read on!
We just wrapped up our 2020 Online DOE Summit. What a successful summit. A group of influential speakers kicked off the discussion of design of experiments (DOE). Hundreds of attendees logged in to each talk and soaked up that knowledge. Thank you to everyone who participated.
We created the summit because of the COVID-19 pandemic. Originally scheduled for the middle of June, our 8th European DOE Meeting was canceled in January. So, after thinking about it for a bit, we decided to move the meeting online. This would be the only way to have a meeting for a while. Plus, the cost to the audience would be zero.
All the speakers who agreed to speak at the European meeting agreed to make the move to a virtual event. A schedule was set-up. We gave it a new name. We sent emails to everyone with dates. The 2020 Online DOE Summit was born.
Our first group of presentations consisted of a kickoff talk, three keynotes, and a tutorial. Many of these talks revolved around current directions in DOE. Even though DOE has been around for decades, it is an evolving practice with new techniques and advice coming up all the time. Each speaker discussed broad concepts in design of experiments.
[Click on the title of the talk for a video recording of the presentation.]
Kickoff: Know the SCOR for Multifactor Strategy of Experimentation
Mark Anderson: Principal of Stat-Ease, Inc.
Talk Topic: Laying out a strategy for multifactor design of experiments
Keynote: My Lifelong Journey with DOE
Pat Whitcomb: Founding Principal of Stat-Ease, Inc.
Talk topic: Pat explores his lifetime of design of experiments with a view to the future
Keynote: Some Experiences in Modern Experimental Design
Marcus Perry: Editor in Chief, Quality Engineering; Professor of Statistics, The University of Alabama
Talk topic: Handling non-standard situations in today’s DOE environment
Keynote: Innovative Mixture-Process Models
Geoff Vining: Professor of Statistics, Virginia Tech
Talk Topic: An overview of KCV designs that limit runs in experiments involving both mixture components and process variables
Tutorial: Strategies for Sequential Experimentation
Martin Bezener: Director of Research & Development, Stat-Ease, Inc.
Talk Topic: This presentation explores how it may be more efficient to divide an experiment into smaller pieces. Learn how to use resources in a smarter, more adaptive manner.
In the second week of the summit, we had a separate set of talks. Each one detailed real-world experiments. Presenters discussed the actual experiments they had worked on, and how they used DOE in each case.
Simultaneous and Quick Determination of Two Ingredients Concentrations in a Solution Using a UV-Vis Spectroscopy Chemometric Model
Samd Guizani: Process Scientist, Ferring International Center
Use of DOE for 3D Printer Ink Formulation Development
Uri Zadok: Senior Research Chemist, Stratasys
Using Experimental Design to Optimize the Surfactant Package Properties of a Metalworking Cleaner
Mathijs Uljé: Development Chemist, Quaker Houghton
Optimizing Multi-Step Processes with DoE – A Cryopreservation Protocol for Plant Cells as a Case
Johannes Buyel: Head of Department of Bioprocess Engineering, Aachen University
In all, this was a great summit. The presenters were spot on with the current state of DOE, whether in modern concepts or real-life experiments. The audience took away many useful ideas and practices. It was a classic case of making lemonade from lemons.
Thanks all!
Greg's DOE Adventure - Factorial Design, Part 2
[Disclaimer: I’m not a statistician. Nor do I want you to think that I am. I am a marketing guy (with a few years of biochemistry lab experience) learning the basics of statistics, design of experiments (DOE) in particular. This series of blog posts is meant to be a light-hearted chronicle of my travels in the land of DOE, not be a text book for statistics. So please, take it as it is meant to be taken. Thanks!]
Keep your experiment planned, but random
When I wrote my introduction to factorial design (Greg’s DOE Adventure - Factorial Design, Part 1), there were a couple of points that I left out. I’ll amend that post here to talk about making sure your experiment is planned out yet random.
Wait. What?
You’ll see. Let me explain.
Getting organized
During the initial phase of an experiment, you should make sure that it is well planned out. First, think about the factors that affect the outcome of your experiment. You want to create a list that’s as all-encompassing as possible. Anything that may change the outcome, put on your list. Then pare it down into the ones that you know are going to be the biggest contributors.
Once you have done that, you can set the levels at which to run each factor. You want the low and high levels to be as far apart as possible. Not too low that you won’t see an effect (if your experiment is cooking something, don’t set the temperature so low that nothing happens). Not too high that it’s dangerous (as in cooking, you don’t want to burn your product).
Finally, you want to make sure your experiment is balanced when it comes to the factors in your experiment. Taking the cooking example above a little further, suppose you have three factors you are testing: time, temperature, and ingredient quality. Let’s also say that you are testing at two different levels: low and high (symbolized by minus and plus signs, respectively). We can write this out in a table:
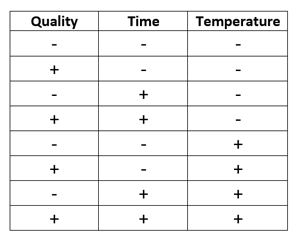
This table contains all the possible combinations of the three factors. It’s called an ‘orthogonal array’ because it’s balanced. Each column has the same number of pluses and minuses (4 in this case). This balance in the array allows all factors to be uncorrelated and independent from each other.
With these steps, you have ensured that your experiment is well planned out and balanced when looking at your factors.
Always randomize
At the start of this post, I said that an experiment should be planned out, yet random. Well we have the planned-out part, now let’s get into the random part.
In any experimentation, influence from external sources (variables you are not studying) should be kept to a minimum. One way to do this is randomizing your runs.
As an example, let’s look at the table above with the cooking example. Let’s say that it represents the order of how the experiment was run. So, all the low temperature runs were made together and then all the high ones together. This makes sense, right? Perform all the runs at one temperature before adjusting up to the next setting.
The problem is, what if there is an issue with your oven that causes the temperature to fluctuate more, early in the experiment and less later. This time-related issue introduces variation (bias) into your results that you didn’t know about.
To reduce the influence of this variable, randomize your run order. It may take more time adjusting your oven for every run, but it will remove that unwanted variation.
Temperature is a popular example to illustrate randomization. But this can be said of any factor that may have time-related problems. It could be warm-up time on a machine or the physical tiring of an operator. Randomization is used to guard against bias as much as you can when running an experiment.
Conclusions
Hopefully, you see now why I said to keep your experiments planned but random. It sounds like an oxymoron, but it’s not. Not in the way I’m talking about it here!
Stat-Ease - Here for You
Stat-Ease is here for you during these trying times. We can help you with your design and analysis of experiments, whether at home or in the lab. Please reach out if you have a question, sales@statease.com
A summary of information that may be important to you
Access to Design-Expert® software while working at home:
- Download a free trial at www.statease.com/trial/. (Used your DX12 trial already? Ask us!)
- Network users - temporarily bring a license home by checking out a roaming license from your server. Go to www.statease.com/docs/v12/network-installation/#roaming-licenses for more information.
- Need Technical Assistance? Email support@statease.com
Access to FREE educational materials:
- Elearning - learn DOE on demand at the Stat-Ease Academy. Go to www.statease.com/training/academy/ to sign up.
- Hear from our DOE experts: visit our Webinars page at www.statease.com/webinars/ and our YouTube channel, www.youtube.com/channel/UCzf_5--odkQ4w25m5r09bWA
- Dive into Design-Expert software: Tutorials (www.statease.com/docs/v12/tutorials/)
2020 European Conference: Our conference (www.statease.com/events/doe-user-meetings/8th-european-doe-meeting/) is being re-imagined into an online opportunity that will be accessible to our global audience!
To receive information by email, go to www.statease.com/publications/signup/ and signup for our email list.
If you have other needs while transitioning to a new work setup, or an Academic online learning environment, please contact sales@statease.com
Background on the KCV Designs
Design-Expert® software, v12 offers formulators a simplified modeling option crafted to maximize essential mixture-process interaction information, while minimizing experimental costs. This new tool is nicknamed a “KCV model” after the initials of the developers – Scott Kowalski, John Cornell, and Geoff Vining. Below, Geoff reminisces on the development of these models.
To help learn this innovative methodology, first view a recorded webinar on the subject.
Next, sign up for the workshop "Mixture Design for Optimal Formulations".
The origin of the KCV designs goes back to a mixtures short-course that I taught for Doug Montgomery at an adhesives company in Ohio. One of the topics was mixture-process variables experiments, and Doug's notes for the course contained an example using ratios of mixture proportions with the process variables. Looking at the resulting designs, I recognized that ratios did not cover the mixture design space well. Scott Kowalski was beginning his dissertation at the time. Suddenly, he had a new chapter (actually two new chapters)!
The basic idea underlying the KCV designs is to start with a true second-order model in both the mixture and process variables and then to apply the mixture constraint. The mixture constraint is subtle and can produce several models, each with a different number of terms. A fundamental assumption underlying the KCV designs is that the mixture by process variable interactions are of serious interest, especially in production. Typically, corporate R&D develops the basic formulation, often under extremely pristine conditions. Too often, R&D makes the pronouncement that "Thou shall not play with the formula." However, there are situations where production is much smoother if we can take advantage of a mixture component by process variable interaction that improves yields or minimizes a major problem. Of course, that change requires changing the formula.
Cornell (2002) is the definitive text for all things dealing with mixture experiments. It covers every possible model for every situation. However, John in his research always tended to treat the process variables as nuisance. In fact, John's intuitions on Taguchi's combined array go back to the famous fish patty experiment in his book. The fish patty experiment looked at combining three different types of fish and involved three different processing conditions. John's intuition was how to create the best formulation robust to the processing conditions, recognizing that the use of these fish patties was in a major fast-food chain. The processing conditions in actual practice typically were in the hands of teenagers who may or may not follow the protocol precisely.
John's basic instincts followed the corporate R&D-production divide. He rarely, if ever, truly worried about the mixture by process variable interactions. In addition, his first instinct always was to cross a full mixture component experiment with a full factorial experiment in the process variables. If he needed to fractionate a mixture-process experiment, he always fractionated the process variable experiment, because it primarily provided the "noise".
The basic KCV approach reversed the focus. Why can we not fractionate the mixture experiment in such a way that if a process variable is not significant, the resulting design projects down to a standard full mixture experiment? In the process, we also can see the impact of possible mixture by process variable interactions.
I still vividly remember when Scott presented the basic idea in his very first dissertation committee meeting. Of course, John Cornell was on Scott's committee. In Scott's first committee meeting, he outlined the full second-order model in both the mixture and process variables and then proceeded to apply the mixture constraint in such a way as to preserve the mixture by process variable interactions. John, who was not the biggest fan of optimal designs when a standard mixture experiment would work well, immediately jumped up and ran to the board where Scott was presenting the basic idea. John was afraid that we were proposing to use this model and apply our favorite D-optimal algorithm, which may or may not look like a standard mixture design. John and I were very good friends. I simply told him to sit down and wait a few minutes. He reluctantly did. Five minutes later, Scott presented our design strategy for the basic KCV designs, illustrating the projection properties where if a process variable was unimportant the mixture design collapsed to a standard full mixture experiment. John saw that this approach addressed his basic concerns about the blind use of an optimal design algorithm. He immediately became a convert, hence the C in KCV. He saw that we were basically crossing a good design in the process variables, which itself could be a fraction, with a clever fraction of the mixture component experiment.
John's preference to cross a mixture experiment with a process variable design meant that it was very easy to extend these designs to split-plot structures. As a result, we had two very natural chapters for Scott's dissertation. The first paper (Kowalski, Cornell, and Vining 2000) appeared in Communications in Statistics in a special issue guest edited by Norman Draper. The second paper (Kowalski, Cornell, and Vining 2002) appeared in Technometrics.
There are several benefits to the KCV design strategy. First, these designs have very nice projection properties. Of course, they were constructed specifically to achieve this goal. Second, it can significantly reduce the overall design size while still preserving the ability to estimate highly informative models. Third, unlike the approach that I taught in Ohio, the KCV designs cover the mixture experimental design space much better while still providing the equivalent information. The underlying models for both approaches are equivalent.
It has been very gratifying to see Design-Expert incorporate the KCV designs. We hope that Design-Expert users find them valuable.
References
Cornell, J.A. (2002). Experiments with Mixtures: Designs, Models, and the Analysis of Mixture Data, 3rd ed. NewYork: John Wiley and Sons.
Kowalski, S.M., Cornell, J.A., and Vining, G.G. (2000). “A New Model and Class of Designs for Mixture Experiments with Process Variables,” Communications in Statistics – Theory and Methods, 29, pp. 2255-2280.
Kowalski, S.M., Cornell, J.A., and Vining, G.G. (2002). “Split-Plot Designs and Estimation Methods for Mixture Experiments with Process Variables,” Technometrics, 44, pp. 72-79.